Debugging performance issues
In the ecommerce business, website performance and user experience are closely connected. That means that performance can directly impact sales conversion rate, user session time, among other relevant metrics.
A series of tools are available to measure website performance, such as Lighthouse/PageSpeed Insights and SpeedCurve.
Keeping an eye on how your store's website performs is essential for delivering a fast and efficient solution to final users.
With that in mind, the Instructions intends to guide you when debugging performance issues, aiming for high scores in Lighthouse audits.
The practices presented in this doc are intended to guide you when debugging your store's performance, they do not provide definitive solutions. For information on how to improve performance, folow this link.
Instructions
Before proceeding any further, we recommend that you run Lighthouse using the following URL pattern https://{account}.myvtex.com/?workspace={workspace}, given the production workspace you're currently working, and take note of your store's performance. You can also analyze the store in production. In this case, please consider the URL available to end-users.
Keep in mind: you must always use the
?workspace={workspace}query string to analyze performance in a production workspace. Using the standard URL patternhttps://{workspace}--{account}.myvtex.com/won't show the performance score of your store in the specified workspace.
Also, when running Lighthouse, consider analyzing pages from different contexts separately. For example, run specific audits for the Home, Search, Category, and Product pages.
Step 1: Testing the server-side rendering
Most websites use JavaScript to support a dynamic and interactive user experience.
Generally, the amount of JavaScript that is shipped to the browser increases as the application complexity grows, for example, with the inclusion of third-party scripts and other JavaScript libraries.
However, it is important to remember that JavaScript handles data fetching, templating, and routing on the client-side rather than on the server-side.
Consequently, JavaScript must be processed before the page content is rendered, competing for processing power and delaying the rendering process.
In light of that, you may want to see how your web page looks and behaves when JavaScript is disabled.
Adopting this practice will help you implement progressive improvements. That is, guaranteeing your server-side rendering (SSR) HTML is functional and free of bugs so you can improve your website's capabilities through JavaScript.
If applicable, check Google's documentation on how to disable javascript in Google Chrome.
When performing this test, your store will probably not function the same way as planned. However, its core functionalities may work as expected. Take the following subsections as a reference:
Undesired behaviors
- The page does not render anything.
- Instead of updating only the different content, the page is fully refreshed when navigating to another page.
- Misplaced layout.
Expected behaviors
- Simpler design.
- Animations and interactive menus do not work.
- The below-the-fold content does not render.
Before Google crawlers incorporated and improved the indexing of JavaScript content and links capability, SEO used to be a common concern for websites based on JavaScript. Even though this issue has been addressed, be aware that other search engines might not have this feature yet.
Step 2: Checking the effect of third-party apps
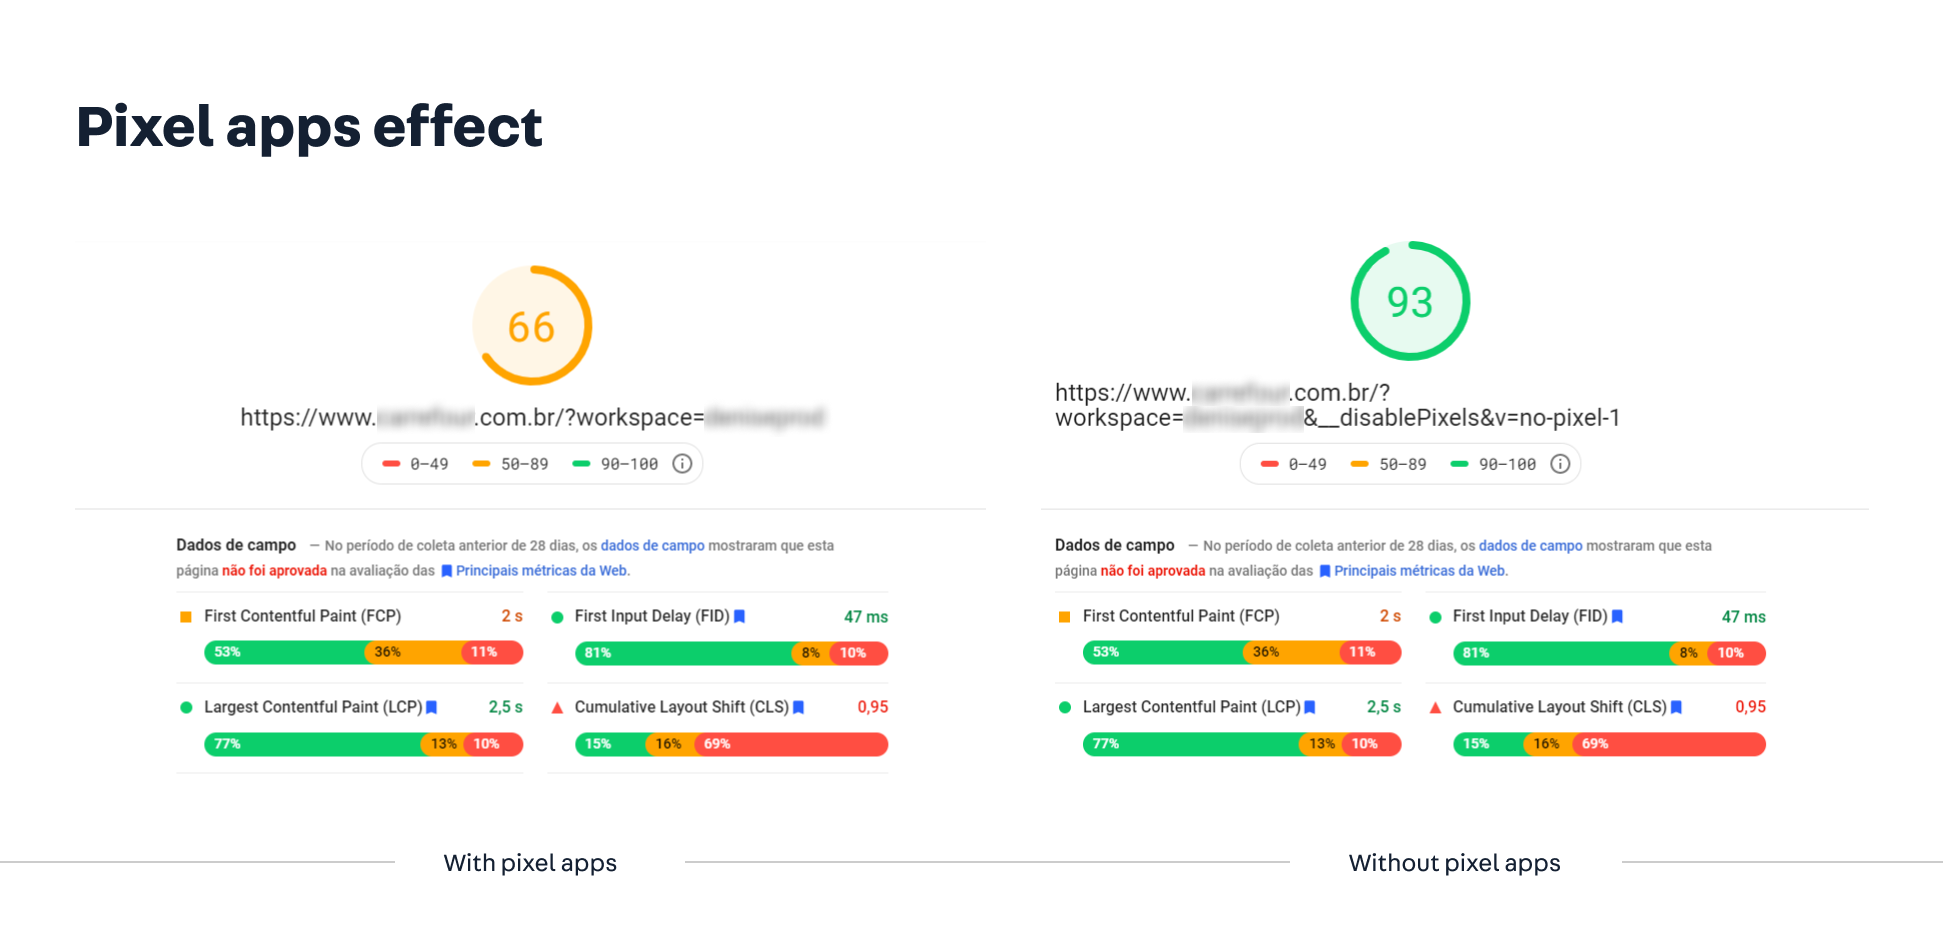
One of the first actions to debug performance issues is to test the desired page without Pixel apps.
Pixel apps are applications that integrate a third-party solution into your store's website.
Checking how your store pages perform without third-party apps might help detect if the problem comes from there.
For that, you must run Lighthouse again, including the __disablePixels and v query strings in the URL, as in the following: https://www.{account}.com.br/?workspace={workspace}&__disablePixels&v={randomvalue}.
Notice that the random value added to the query string
vis used to avoid cache. Remember to replace the values between the curly brackets according to your scenario.
Take the following example:
Step 3: Checking an app's bundle size
If you are building a custom React component, you can get a glimpse of your app's performance by analyzing its bundle size.
The app’s bundle size indicates the size of the JavaScript files needed to load your app.
Large bundle sizes imply a longer loading time. If it is too slow, it may harm performance and, consequently, the user experience.
For analyzing you app's bundle, you can access the following paths:
-
In the development mode:
https://{workspace}--{account}.myvtex.com/_v/private/assets/v1/linked/{app}@{version}/public/react/devReport.html -
In production:
https://{workspace}--{account}.myvtex.com/_v/public/assets/v1/published/{app}@{version}/public/react/[prod|dev]Report.html
Remember to replace the values between the curly brackets according to your scenario.
Here is an example of the result:
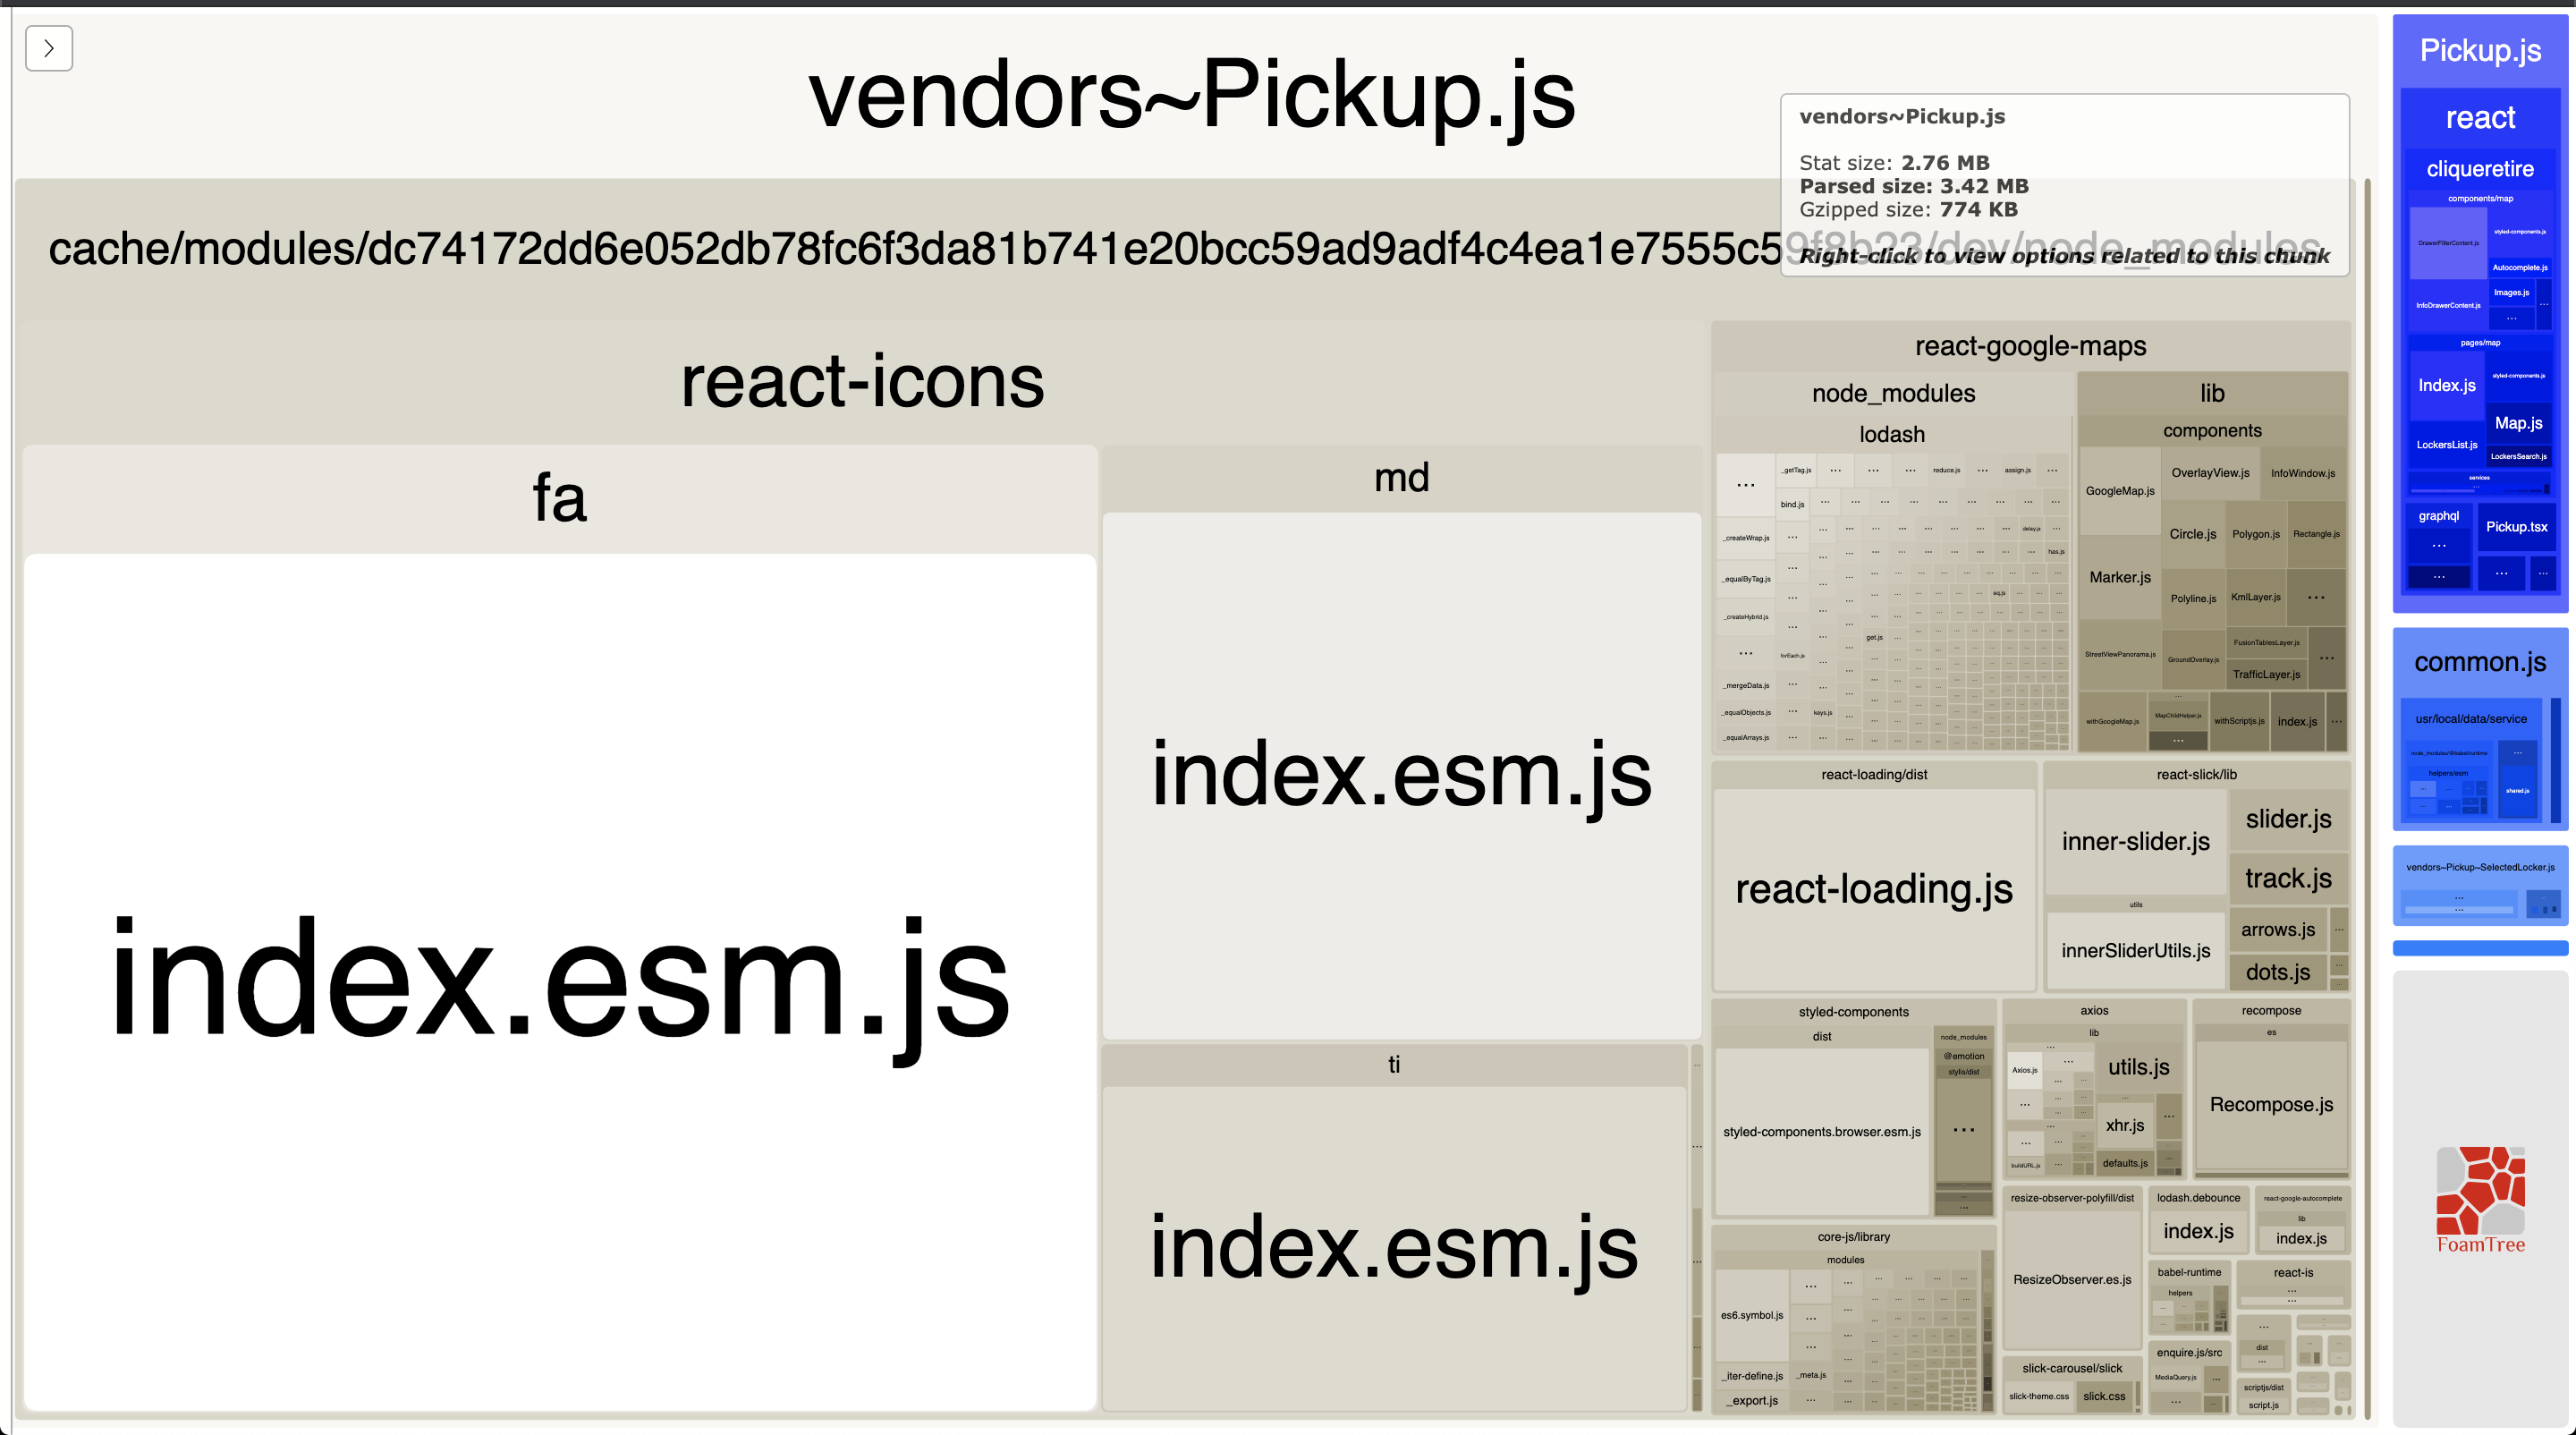
From the given example, we have the name of the bundle (vendors~Pickup.js) followed by the modules folder, in which it's noticeable that the react-icons component takes up the majority of the bundle size.
By knowing that, it's possible to take targeted actions to reduce your app's bundle size. Possible solutions are: code-splitting, fetching bundles asynchronously, and replacing a large dependency with a more minimalistic and specialized solution.
Step 4: Identifying heavy scripts
Use SpeedCurve or any other tool of your preference to detect your website's heaviest scripts, and consider:
- Removing them.
- Replacing them with lighter and similar scripts.
- Implementing alternative loading solutions with a lower negative impact on performance.
Step 5: Enabling performance settings
To help you guarantee the success of your brand's online presence, we provide a series of performance settings, which can be enabled at your stores's admin, under Store Settings > Storefront > Store > Advanced.
Follow this link to learn about the currently available performance settings.
Follow this link to learn how to safely enable performance settings.
We recommend that you gradually enable the available features and measure their impact using Lighthouse and other tools.
Step 6: Testing the critical CSS
VTEX IO offers the option of enabling critical CSS optimization in home pages, product pages, and product listing pages. This feature allows the browser to find the minimum CSS code blocks needed to display the page's critical content first. Meanwhile, the remainder CSS code is loaded asynchronously.
Critical, also known as above-the-fold, refers to the portion of a web page a user sees when first loading a page. Notice that, for a good user experience, the critical content needs to be loaded quickly. Follow this link to learn how to optimize critical CSS.
Critical CSS optimization requires that the page is server-side rendered and that CSS concatenation is enabled. Also, the process of optimizing CSS for each page can take some time and varies depending on the page and viewport size.
CSS optimization may not respond immediately. Only after different users access the same page using a similar viewport will the CSS's optimized version take effect. Take product pages as an example: some products may have SKU selectors, while others don't. Since it isn't necessary to serve SKU selector styles for product pages that don't have this component, product pages might not share the same critical optimization. Similarly, two users accessing the same page using different devices, such as mobile and desktop, won't share the same optimization.
Hence, after enabling the critical CSS optimization, check if your pages are being optimized:
- Make sure your pages are server-side rendered (Step 1)
- Look for the style tag
<style id="critical" type="text/css">inside the<head>tag of the corresponding pages.
Step 7: Using the Lighthouse Scoring Calculator
With the performance features enabled, as proposed in Step 5, reproduce your scores in the Lighthouse Scoring Calculator to identify which metrics have the greatest potential for improvement.
Lighthouse Scoring Calculator is a tool created by Google that allows you to play with Lighthouse performance metrics and define the thresholds you should aim for to achieve the desired Performance Score.
- If the Total Blocking Time (TBT) is too long, use the browser's performance tab and React Dev Tools (if applicable) to identify components running JavaScript for long periods and, consequently, blocking the main thread and impeding the browser to respond to other requests. To improve the implementation of these components, consider breaking tasks into smaller ones so that they do not block the main thread for more than 50ms.
React Dev Tools is a Chrome DevTools extension for the open-source React JavaScript library.
- If First Contentful Paint (FCP) is high, consider prioritizing the above-the-fold content by bringing, at first, only the necessary assets to render that part of the page.
- If Largest Contentful Paint (LCP) is high, consider centering most of the page content on one or fewer elements, such as a banner, and having that part rendered with priority (e.g., loading the main image first).
Follow this link to learn more about Lighthouse metrics.
Follow this link to learn more about how to track changes in Lighthouse performance scores using the Lighhouse Scoring Calculator.